

Blog: How does wind energy affect Irish electricity prices?
06 Mar 2020
In our latest blog on Ireland's electricity system Peter Brennan, CEO of SmartPower, explains what happens to electricity prices on the Irish market when there is more, or less, wind energy on the system.
We know that wind puts downward pressure on electricity prices but at SmartPower we wanted to quantify this. Our analysis suggests that DAM (Day Ahead Market) prices fall on average 30 per cent or €15/MWh due to current wind levels.
Think of the Day Ahead Market price as the price at the power station gate. It is what the company that provides electricity for your home or business is paying for the power they then sell on to you.
Based on a wind production figure of 32 per cent of system demand for 2019, we estimate that this saved approximately €577 million in fossil fuel costs. For 2018, the SEAI Energy in Ireland report estimated wind power reduced fossil fuel buying costs by some €432 million.
We think this figure is a little low since energy prices were higher in 2018 than 2019 plus it does not take into account that wind has largely displaced expensive peaker plants whose use was much more common prior to the high wind levels we now see on the grid.
We also expect DAM prices to be soft with downward pressure for the remainder of 2020 with implications for the RESS auction in Jun-20.
The total cost of wind vs marginal cost
A calculation for the total cost of wind is complicated as there are many factors to consider. When comparing different technologies, say wind farms, solar farms and gas turbines, the industry standard approach is to use a LCOE (Levelised Cost of Energy) calculation.
This is calculated by taking the net present value of the total cost of building and operating the asset and dividing by the total electricity generation over its lifetime (the design lifetime of a wind farm is usually 20-25 years).
Key inputs to calculating the LCOEs include capital costs, fuel costs, fixed and variable operating and maintenance (O&M) costs, financing costs, and assumed usage rates for each technology type. (The LCOEs do not include transmission or distribution costs).
In 2018, the International Renewable Energy Agency (IRENA) estimated the levelised cost of electricity (LCOE) from onshore wind in Europe at €61/MWh.
Though this approach is useful when comparing different technologies - for our purposes as energy traders, we are more interested in the short term effects of wind on the electricity prices ie how they affect marginal cost at the power station gate.
Since 2006, wind development in Ireland has been supported by the REFIT tariff. This was designed to provide support to wind developers by providing them with a minimum price for each unit of electricity exported to the grid over a 15-year period. The scheme is funded by the PSO Levy. The REFIT reference price for the PSO year 2018/2019 was €70.349/MWh (REFIT 2 Strike Price €69.99/MWh). REFIT was closed for new entrants in 2019 and replaced by the RESS. A new RESS-1 auction is planned for June 2020.
Our analysis suggests DAM prices will be soft going forward (around €40/MW) and this has implications for the RESS scheme.
The big driver of electricity costs
In the wholesale electricity market generators compete in daily auctions to deliver electricity. The bids made by generators reflect, to a large extent, their short-run marginal cost of electricity generation, which consists largely of fuel, carbon and variable operating costs.
In these auctions generators with lower marginal costs will clear first, and the power price is set by the marginal generator, which is the generator with the highest marginal costs that is still needed to meet electricity demand. Put another way, the power price is set by the most expensive generator needed to provide the electricity to meet demand.
Wind generation has a marginal cost of close to zero and virtually always clears the auction which effectively means the price is then set by the remaining fossil fuel generators, the most important of which is gas. Thus gas is the main driver of marginal Irish electricity cost (we use UK NBP gas prices as this tends to be the benchmark). You can see the great correlation between DAM & gas prices in Graph 1.
Graph 1
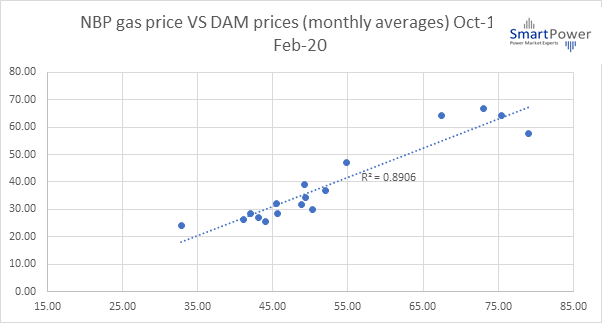
Natural gas share of electricity generated is approximately 55 per cent but it sets the price ‘at the margin.’
Prior to the introduction of the new traded I-SEM electricity market in Oct 2018, a code of practice between the regulator and fossil fuel plants ensured that electricity prices shadowed the gas price closely.
Since the introduction of I-SEM, (which is more of a financially traded style market), wind has greatly increased its impact on prices. Nevertheless, gas remains the price setter and this is shown by the good correlation between DAM prices & gas prices.
Since I-SEM was introduced, we have seen a 10 year high to low swing in gas prices. Graph 2 (from Sept 2018 to May 2019) which allows us to look how this spread of prices impacted DAM prices.
Graph 2
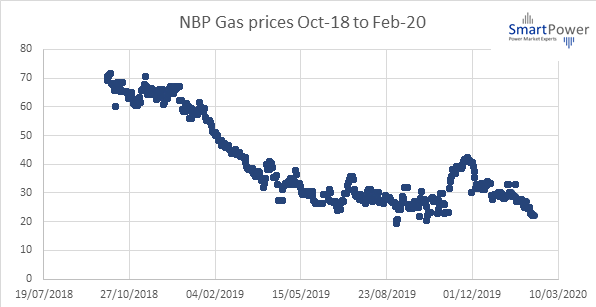
Over the past year or so DAM prices have averaged around €53/MWH. However, they have trended down over that time to 10 year lows around €40/MW (very low for the winter period). Our projection is that gas prices will be soft for the foreseeable future (unless there is a big geopolitical event) so that this DAM price level of €40/MW will be sticky with possibly more downward pressure to come.
These low prices have implications for the level of the PSO levy which is set by the Commission for Regulation of Utilities (CRU) in October every year. In 2018 the levy was reduced by 55 per cent & decreased again in 2019 by 16 per cent (much of the reduction was peat related).
The last PSO paper used a benchmark price of €57.37/MWh for the calculation of the final PSO levy for the 2019/20 PSO period. Wind support via REFIT 1 & REFIT 2 had higher levels. The large delta between these figures and the DAM price leaves a gap that the CRU will need to consider. The fact that solar will have a call on RESS for the first time will also make a impact (there are already 72 applications).
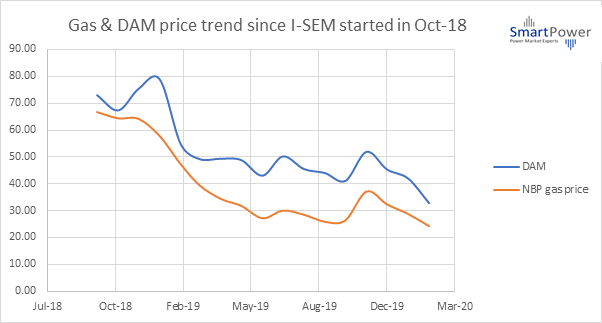
Graph 3 below shows how both DAM and gas prices have followed each other down over the past year or so.
Graph 3
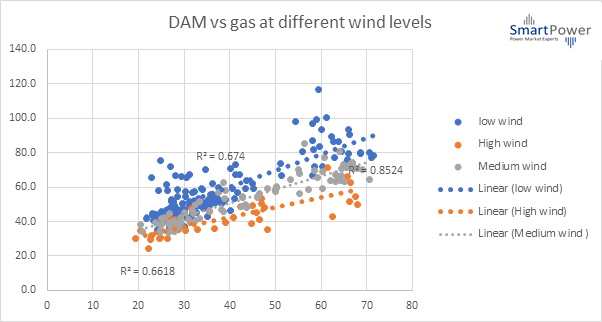
Wind also has a significant effect on DAM prices and you can see this in graph 4 with high, low & medium wind plotted adjusted for the same gas price. Our analysis suggests that DAM prices fall on average €15/MWh due to wind.
Graph 4
See www.smartpower.ie for more details. If you have any questions or would like to sign up for free newsletter please contact me at This email address is being protected from spambots. You need JavaScript enabled to view it. or on 086 8402190


